First Citizens Investment Services Annual Reports
First Citizens Investment Services Limited and its Subsidiaries
(Presented in Trinidad and Tobago Dollars)
Annual Report 2024
Summary of highlights for fiscal 2024
- Profit before tax decreased by 7% from 2023 $175.2M to 2024 $163.4M
- Profit after tax amounted to $138.9M in 2024 compared to 2023 $145.4M
- Shareholders’ Equity stood at $1.5332B reflecting an increase of 9% from 2023 $1.413B
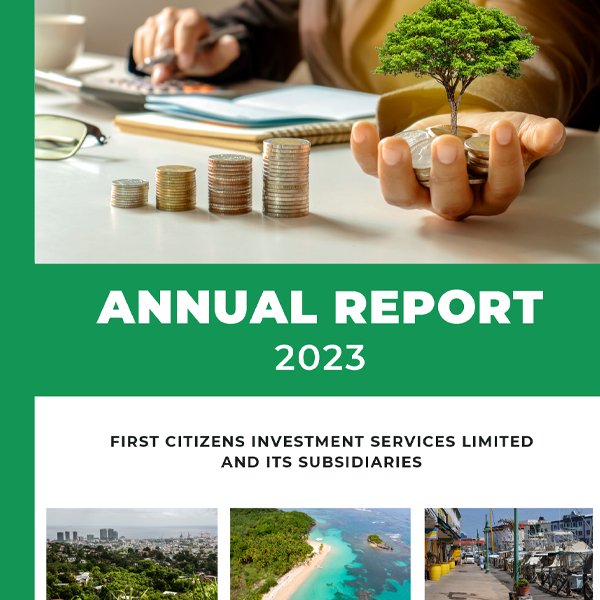
Annual Report 2023
Summary of highlights for fiscal 2023
- Profit before tax decreased by 6% from 2022 $185.8M to 2023 $175.2M
- Profit after tax amounted to $145.4M in 2023 compared to 2022 $151.8M
- Shareholders’ Equity stood at $1.413B reflecting an increase of 0.4% from 2022 $1.407B
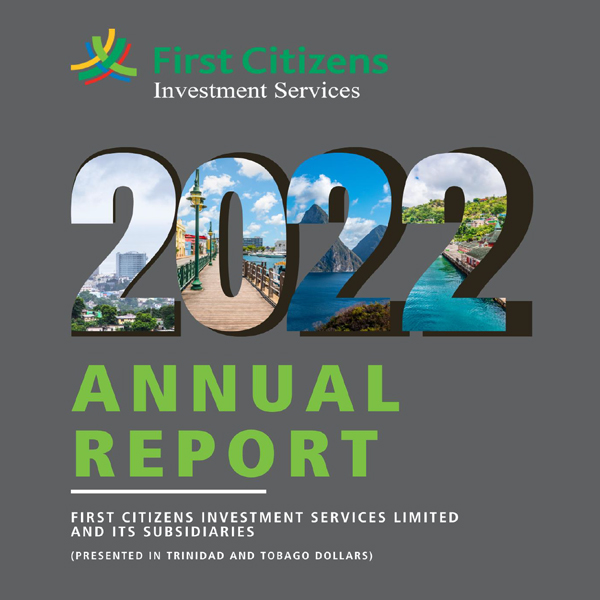
Annual Report 2022
Summary of highlights for fiscal 2022
- Profit before tax decreased by 13.5% from 2021 $214.9M to 2022 $185.8M
- Profit after tax amounted to $151.8M in 2022 compared to 2021 $172.8M
- Shareholders’ Equity stood at $1.4B reflecting a decrease of 12% from 2021 $1.6B
Annual Report 2021
Summary of highlights for fiscal 2021
- Profit before tax decreased by 13.5% from 2021 $214.9M to 2022 $185.8M
- Profit after tax amounted to $151.8M in 2022 compared to 2021 $172.8M
- Shareholders’ Equity stood at $1.4B reflecting a decrease of 12% from 2021 $1.6B

Annual Report 2020
Summary of highlights for fiscal 2020
- Profit before tax decreased by 13.5% from 2021 $214.9M to 2022 $185.8M
- Profit after tax amounted to $151.8M in 2022 compared to 2021 $172.8M
- Shareholders’ Equity stood at $1.4B reflecting a decrease of 12% from 2021 $1.6B

Annual Report 2019
Summary of highlights for fiscal 2019
- Profit before tax decreased by 13.5% from 2021 $214.9M to 2022 $185.8M
- Profit after tax amounted to $151.8M in 2022 compared to 2021 $172.8M
- Shareholders’ Equity stood at $1.4B reflecting a decrease of 12% from 2021 $1.6B

Annual Report 2018
Summary of highlights for fiscal 2018
- Profit before tax decreased by 13.5% from 2021 $214.9M to 2022 $185.8M
- Profit after tax amounted to $151.8M in 2022 compared to 2021 $172.8M
- Shareholders’ Equity stood at $1.4B reflecting a decrease of 12% from 2021 $1.6B

Annual Report 2017
Summary of highlights for fiscal 2017
- Profit before tax decreased by 13.5% from 2021 $214.9M to 2022 $185.8M
- Profit after tax amounted to $151.8M in 2022 compared to 2021 $172.8M
- Shareholders’ Equity stood at $1.4B reflecting a decrease of 12% from 2021 $1.6B